If you've heard the term 'standard deviation' floating around in your SAT prep and it sounds a little intimidating, don't worry! It's actually a pretty straightforward concept that can give you an edge on test day. Here's what you need to know:
What in the World is Standard Deviation?
Think of standard deviation as a measure of how spread out numbers are within a set of data. Here's a simple example:
- Set 1: 5, 6, 6, 7, 8 (numbers are fairly close together)
- Set 2: 1, 4, 7, 10, 12 (numbers are more spread out)
Set 2 would have a higher standard deviation than Set 1 because the numbers cover a wider range away from the average.
Why Does It Matter for the SAT?
The SAT likes to test your understanding of standard deviation without the need for complex calculations. Here are the types of questions you might encounter:
- Comparing Standard Deviations: You'll be given two sets of data and asked which one likely has a larger standard deviation. Focus on how spread out the numbers are.
- Visualizing Standard Deviation: Graphs or line plots can tell you a lot. A wider spread in the data usually means a higher standard deviation.
- Real-World Scenarios: A question might describe two situations and ask you which one likely involves a higher standard deviation. Think about the typical variability in that situation.
Tips for Success
- Focus on the "Spread": Remember, standard deviation is about how dispersed the numbers are from the average (mean) of the dataset.
- Look for Big Differences: If one data set has a much wider range or more extreme values, that usually indicates a higher standard deviation.
- Practice with Visuals: Line plots and graphs are super helpful for visualizing standard deviation. Get used to interpreting them.
Test your understanding with these SAT-style questions
Here are 5 SAT-style questions about standard deviation, along with solutions and explanations:
Question 1
A farmer records the weight of watermelons from two different fields. Which field likely has a higher standard deviation in watermelon weights?
- Field A: Most watermelons weigh between 8 and 12 pounds.
- Field B: Watermelon weights range from 5 to 15 pounds.
Answer: Field B has a wider range of weights, suggesting a higher standard deviation.
Question 2
Two groups of students took the same math quiz. Here are the scores:
- Group A: 65, 75, 75, 80, 85
- Group B: 50, 70, 80, 90, 100
Which of the following is true about the standard deviations of the two groups?
(A) The standard deviation of Group A is less than the standard deviation of Group B.
(B) The standard deviation of Group A is equal to the standard deviation of Group B.
(C) The standard deviation of Group A is greater than the standard deviation of Group B.
(D) The relationship between the standard deviations cannot be determined.
Solution:
- Focus on the spread: Standard deviation measures how spread out a data set is. Group B's scores are more widely spread out than Group A's scores.
- Answer: (C) The standard deviation of Group A is greater than the standard deviation of Group B.
Question 3
A scientist measured the growth of two groups of plants over a week. The average growth for both groups was 5 centimeters. The following line plots show the individual growth measurements for each group:
Which of the following correctly compares the standard deviations of the two groups?
(A) The standard deviation of Group A is less than Group B.
(B) The standard deviation of Group A is equal to Group B.
(C) The standard deviation of Group A is greater than Group B.
(D) It cannot be determined without calculating the standard deviation.
Solution:
- Visualize the spread: Line plots help visualize standard deviation. Group B shows a wider spread in its growth measurements compared to Group A.
- Answer: (A) The standard deviation of Group A is less than Group B.
Question 4
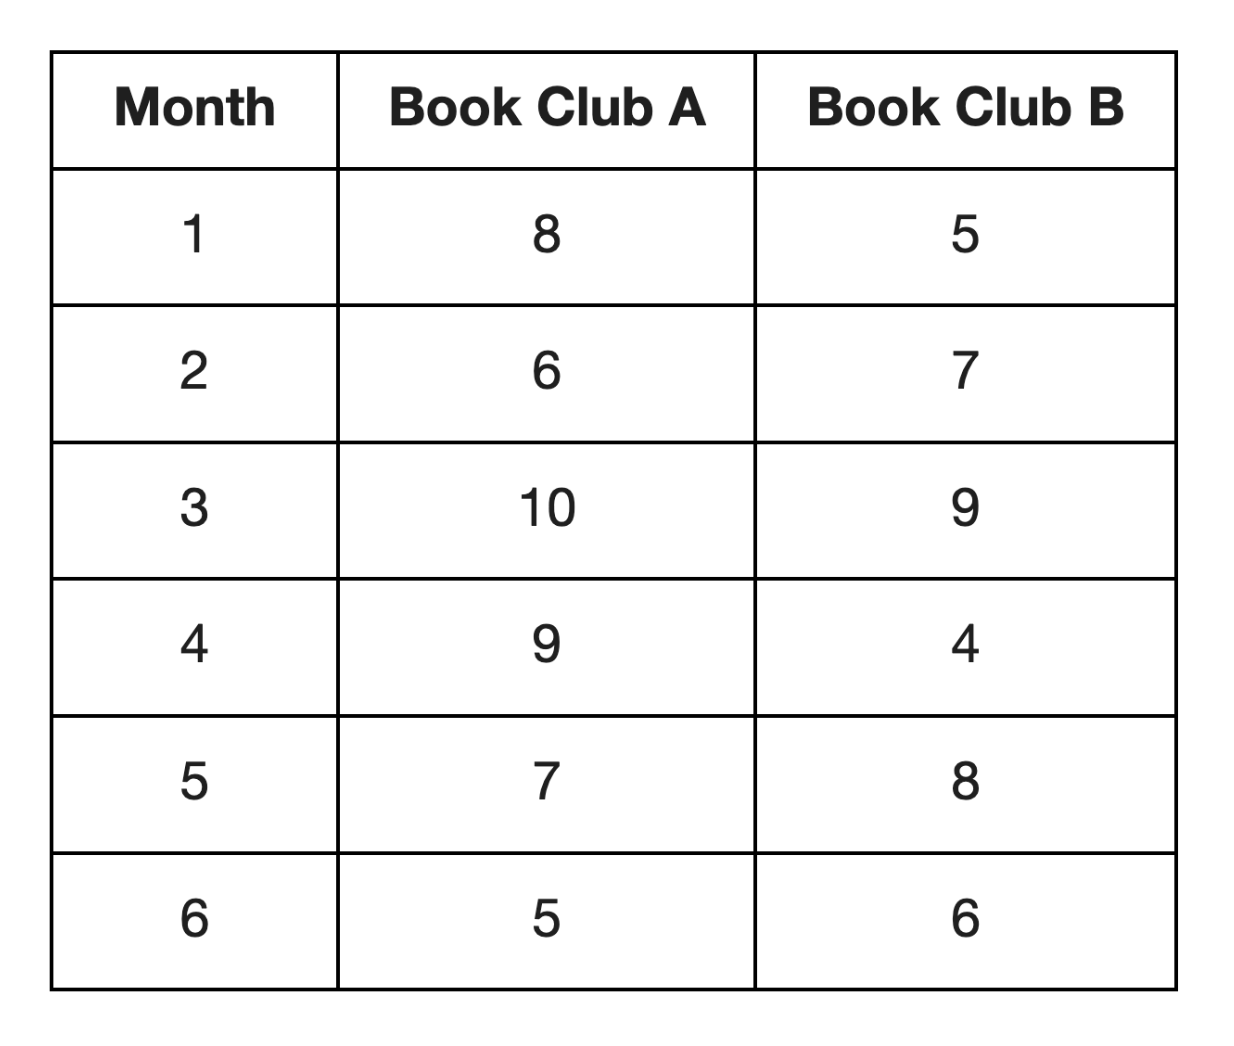
The following table shows the number of books read by two book clubs over the past 6 months:


Which book club likely has a higher standard deviation for the number of books read per month?
(A) Book Club A
(B) Book Club B
(C) The standard deviations are equal
(D) It cannot be determined from the given information.
Solution:
- Look for larger variations: Book Club A has a wider range of books read across the months (5 to 10) compared to Book Club B (4 to 9). This usually indicates a higher standard deviation.
- Answer: (A) Book Club A
Question 5:
Two high schools track the average daily attendance of their students throughout a school year.
- School A: Daily attendance ranges from 902 students to 946 students.
- School B: Daily attendance ranges from 855 students to 1020 students.
Which school is likely to have a higher standard deviation in its daily attendance?
- (A) School A
- (B) School B
- (C) The standard deviations are likely the same
- (D) It cannot be determined with the given information
Solution:
- Focus on the range: School B has a much wider range in daily attendance (a difference of 165 students) compared to School A (a difference of 44 students).
- Answer: (B) School B
Wrapping Up Standard Deviation
Standard deviation may seem slightly obscure, but it's a simple concept once you grasp it. Understanding how data is spread out can help snag extra points on the SAT. A few practice questions, and you'll be ready to tackle any standard deviation problems that come your way!
Struggling with the SAT? Get the score you deserve with Schoolhouse! We offer free, personalized SAT tutoring, live classes, and expert homework help to boost your confidence and results. Don't miss out–join our supportive community of learners and level up your SAT prep today! Sign up now to join an SAT Bootcamp!